

In 2024, citizens worldwide will head to the polls, shaping the course of their nations. National elections are slated to occur in countries representing 40% of the global population.[1] The decisions made by these elected officials can hold significant sway over our daily lives, often resulting in laws that directly impact us.
With such high stakes, it is no wonder that national elections stir powerful emotions in many of us. However, emotions and investing rarely make for a harmonious mix. So, let’s momentarily set aside emotional partisan politics and let the data speak to some of the most common investing questions in an election year.
Are Election Years Bad for Markets?
Not really but let’s dig a bit deeper. Since 1926, the average annual return during an election year is about 11.5%.[2] Interestingly, 84% of the time the S&P has posted a positive return in general election years.2 If we stopped here, we would call that a pretty good year. However, when compared to non-election years, the S&P returned 12.4% on average, but only 70% of those years were positive. 2 A modest argument could be made in both the “good” or “bad” camp. Statistically speaking, they are very similar. Importantly, making a market prediction based on the four-year election cycle alone is akin to Punxsutawney Phil’s shadow-based weather forecast. It is not particularly robust.
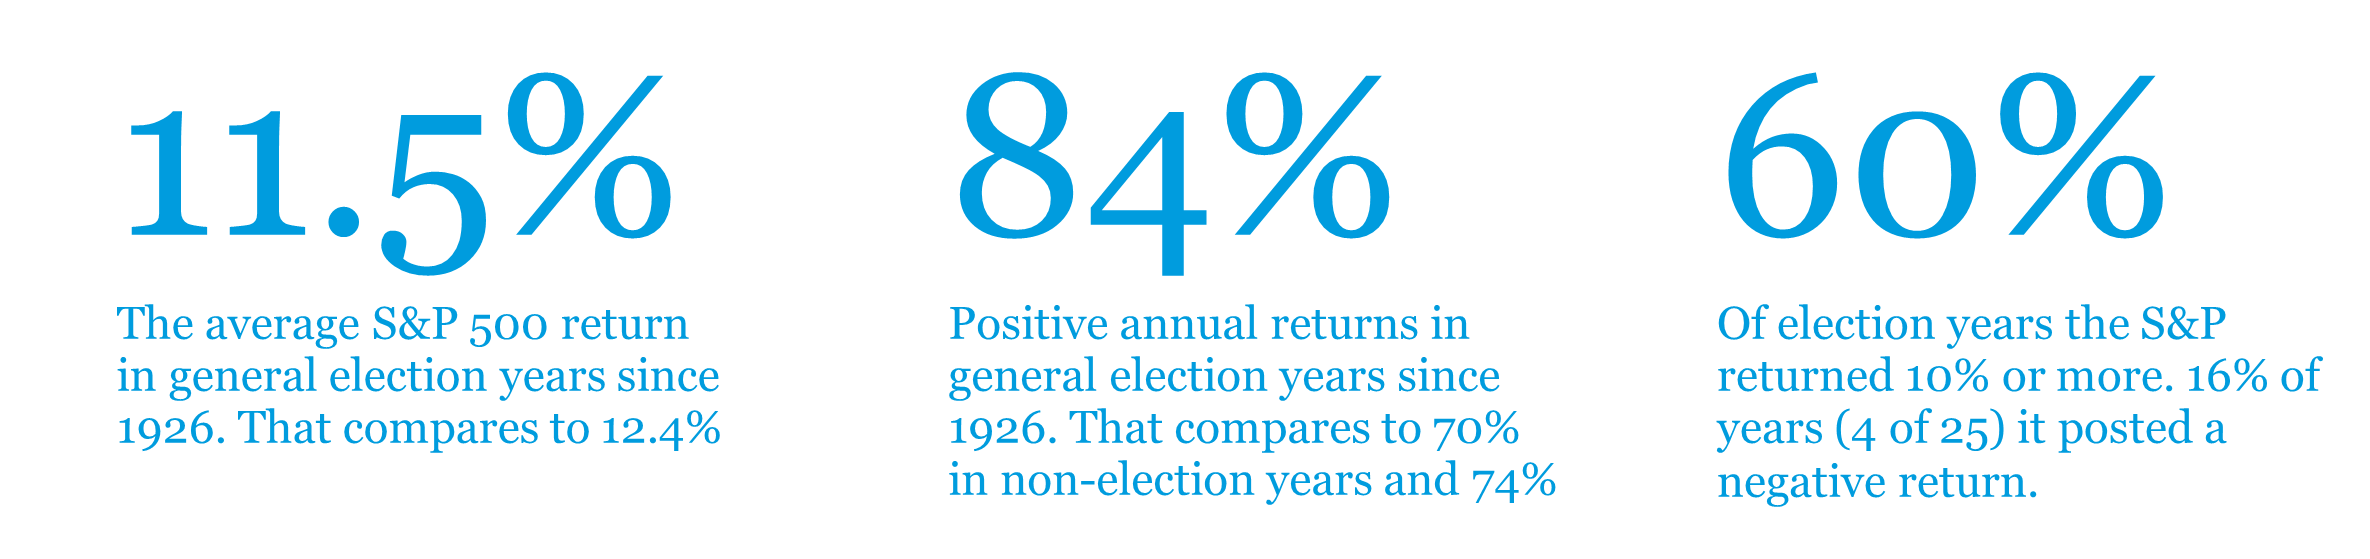
Source: S&P 500 returns since 1926. Wikipedia Party Divisions since 1798.
What do Elections Tell us About the Market/Economy?
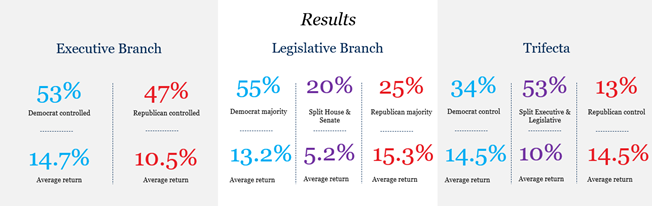
Surprisingly little. Firstly, elections are primarily focused on securing votes and making promises rather than enacting policies and legislation. Furthermore, historical data suggests that markets have thrived under the governance of both political parties, indicating a relatively small divergence in performance between “blue” and “red” governed years. However, it is crucial to recognize that such data can be selectively presented to serve specific agendas, as factors like the chosen time period and overall economic conditions can be manipulated. Ultimately, profits remain impartial to political affiliations over the long run. Thus, basing investment decisions solely on political agendas offers little tangible benefit.
What Does the Market/Economy Tell us About Elections?
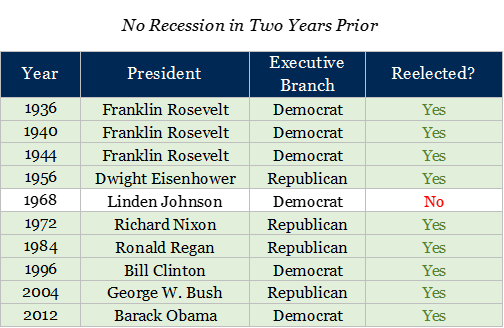
More than you may expect. As famously quoted by James Carville, campaign strategist for Bill Clinton, ‘It’s the economy, stupid.’ He was right. The economic landscape during a sitting President’s term frequently shapes their perceived success. Since 1926, 16 sitting Presidents have sought reelection. Among them, 10 ran for reelection without a recession occurring in their final two years, nine were successful in securing another term.
Source: Wikipedia Party Divisions since 1789. Return is average return of large cap US stocks since 1926 Recession dates based on the National Bureau of Economic Research.
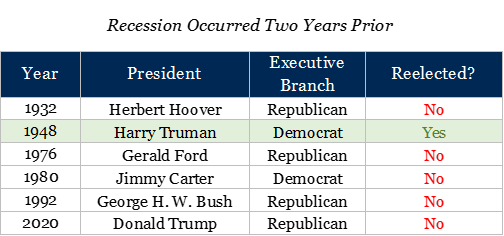
Conversely, of the six Presidents who ran for reelection amid a recession, only one managed to make the grade. Interestingly, years in which a sitting President sought reelection have proven to be more favorable for markets. Reelection years, as opposed to open years, outperformed on average by 5.7%.[3]
The coming months will be inundated with campaign rhetoric aimed at stirring emotions to illicit action at polling booths. However, we believe it wise to contain that action to civic duties rather than portfolio positioning. Elections seldom dictate market outcomes and more importantly, regardless of election results, markets often find a way to persevere.
If you would like more information, please reach out to any of the professionals at HighMark Wealth Management.
Disclosures & Definitions
Comparisons to any indices referenced herein are for illustrative purposes only and are not meant to imply that actual returns or volatility will be similar to the indices. Indices cannot be invested in directly. Unmanaged index returns assume reinvestment of any and all distributions and do not reflect our fees or expenses.
- The S&P 500 is a capitalization-weighted index designed to measure performance of the broad domestic economy through changes in the aggregate market value of 500 stocks representing all major industries.
Material Risks
- Domestic Equity can be volatile. The rise or fall in prices take place for a number of reasons including, but not limited to changes to underlying company conditions, sector or industry factors, or other macro events. These may happen quickly and unpredictably.
[1]Strategas Washington Policy as of January 2, 2024
[2]S&P 500 returns since 1926. Wikipedia Party Divisions since 1789
[3]Return is average return of large cap U.S. based on Wikipedia Party Divisions data since 1789.